Plot method for class mhtest.
Arguments
- x
An object of class
mhtest.- type
Either.
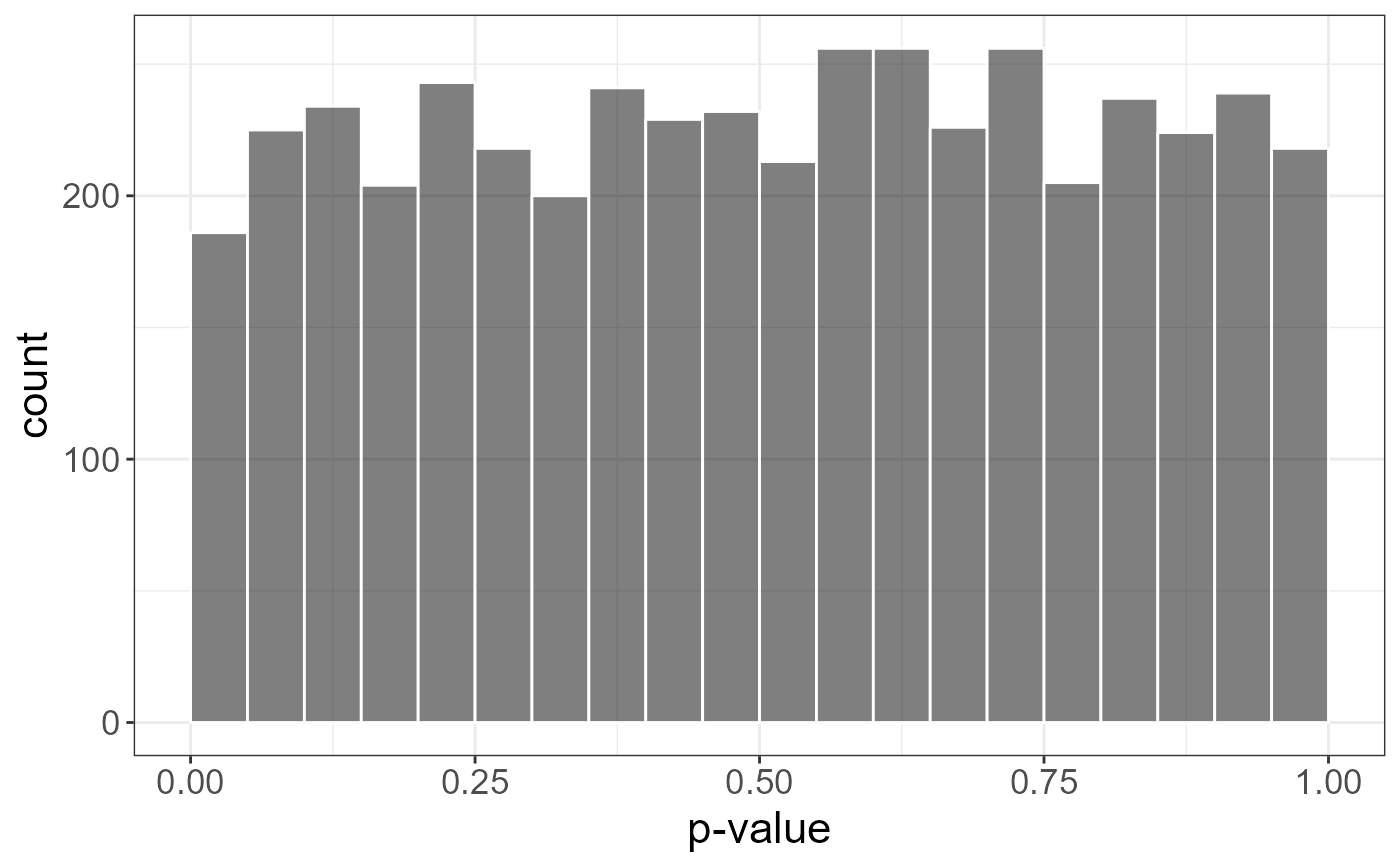
"hist": histogram of p-values (the default).
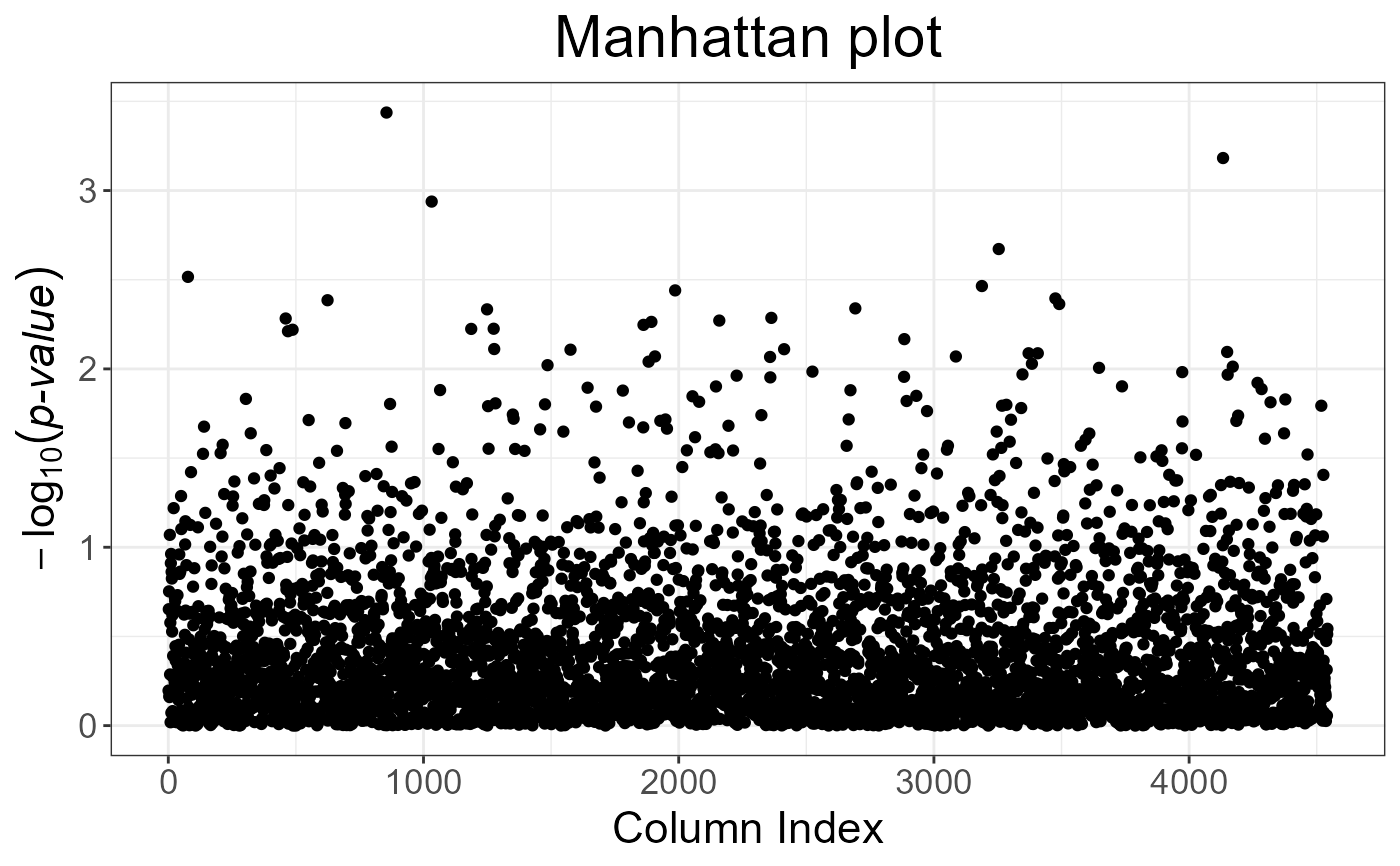
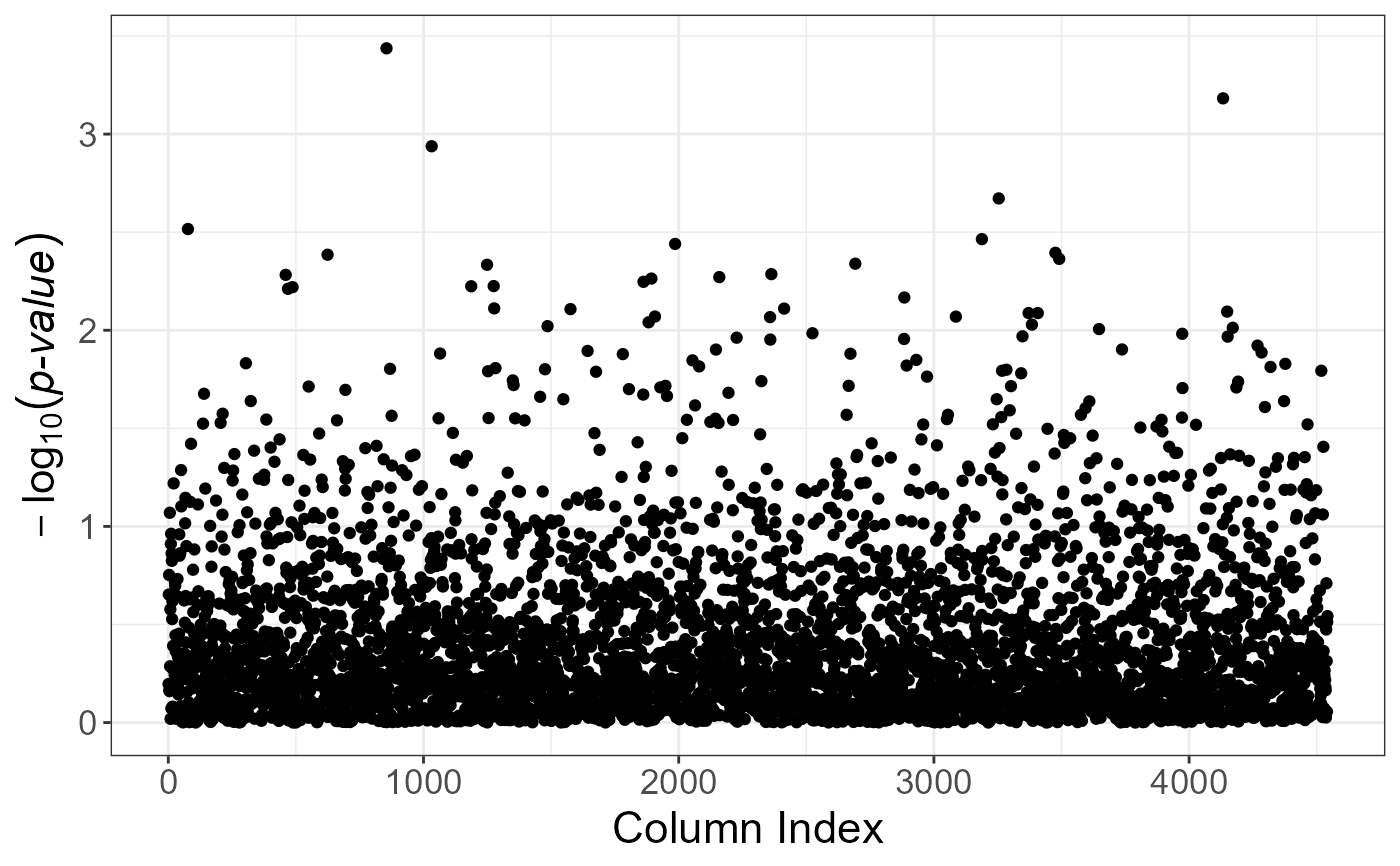
"Manhattan": plot of the negative logarithm (in base 10) of p-values.
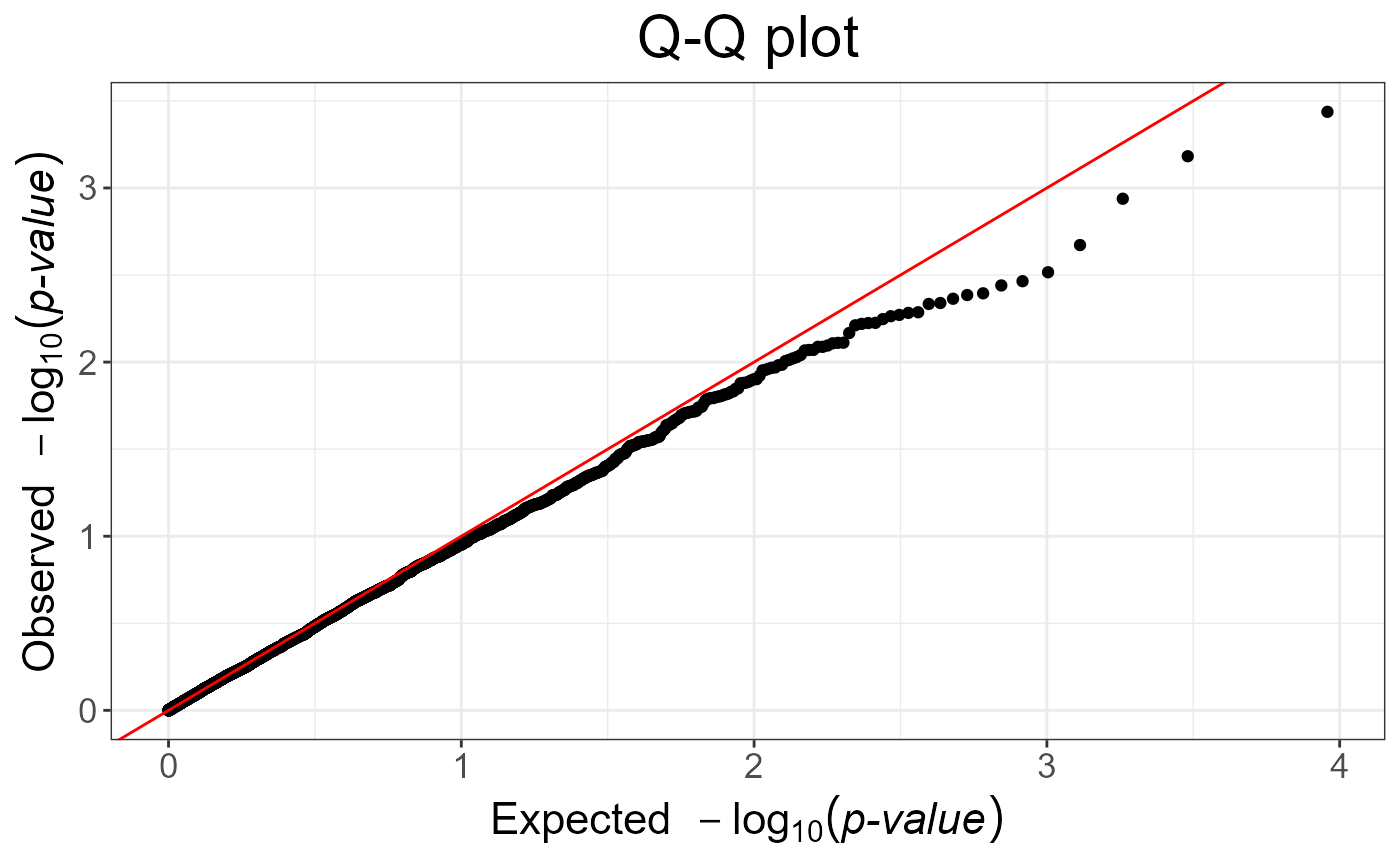
"Q-Q": Q-Q plot.
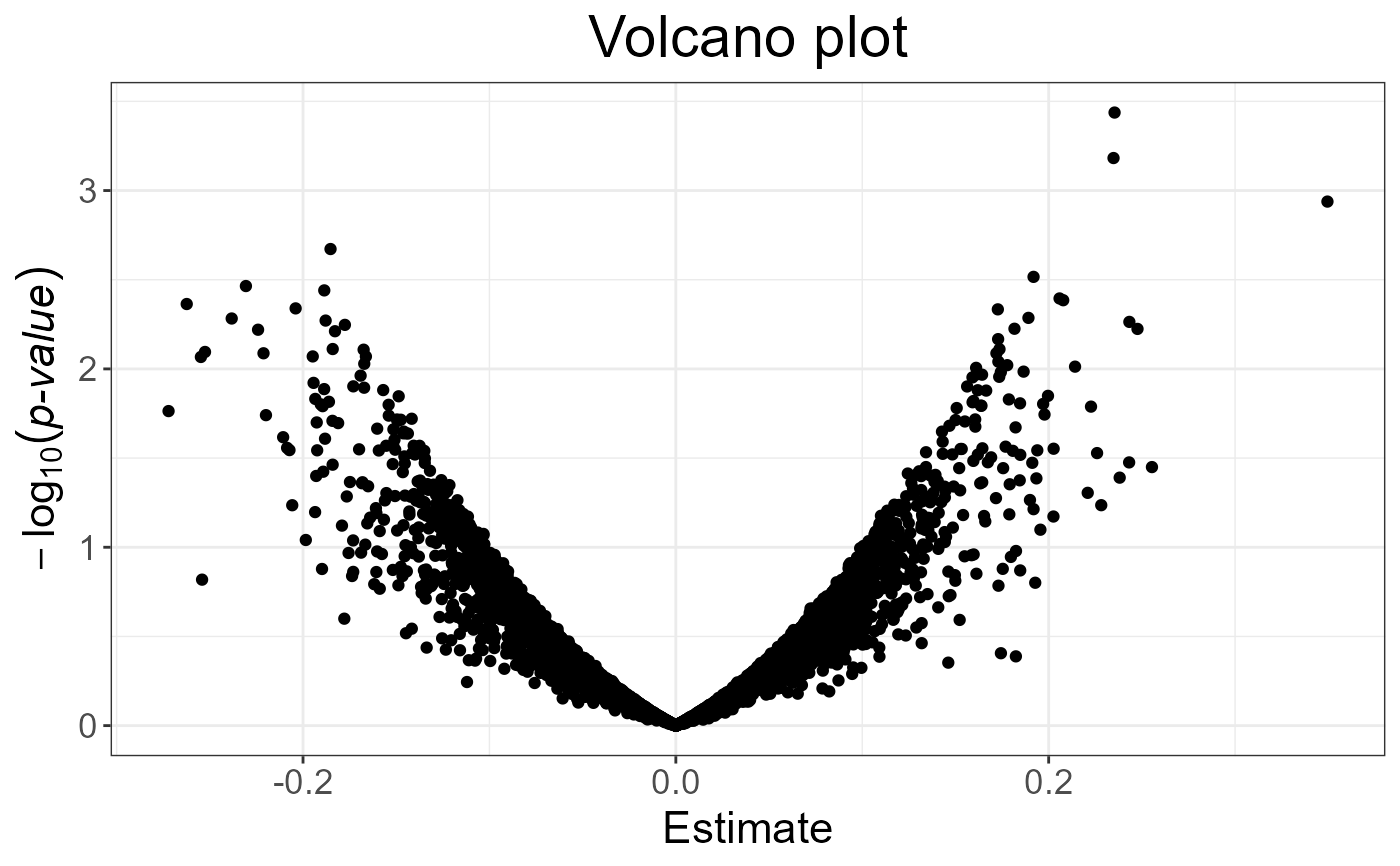
"Volcaco": plot of the negative logarithm of p-values against the estimation of coefficients (e.g. betas in linear regression)
- coeff
Relative size of text. Default is
1.- ...
Not used.
Value
A ggplot2 object. You can plot it using the print method.
You can modify it as you wish by adding layers. You might want to read
this chapter
to get more familiar with the package ggplot2.