Creates a manhattan plot.
Arguments
- gwas
A
mhtestobject with the p-values associated with each SNP. Typically, the output of bigstatsr::big_univLinReg, bigstatsr::big_univLogReg or snp_pcadapt.- infos.chr
Vector of integers specifying each SNP's chromosome.
Typically<bigSNP>$map$chromosome.- infos.pos
Vector of integers specifying the physical position on a chromosome (in base pairs) of each SNP.
Typically<bigSNP>$map$physical.pos.- colors
Colors used for each chromosome (they are recycled). Default is an alternation of black and gray.
- dist.sep.chrs
"Physical" distance that separates two chromosomes. Default is 10 Mbp.
- ind.highlight
Indices of SNPs you want to highlight (of interest). Default doesn't highlight any SNPs.
- col.highlight
Color used for highlighting SNPs. Default uses red.
- labels
Labels of the x axis. Default uses the number of the chromosome there are in
infos.chr(sort(unique(infos.chr))). This may be useful to restrict the number of labels so that they are not overlapping.- npoints
Number of points to keep (ranked by p-value) in order to get a lighter object (and plot). Default doesn't cut anything. If used, the resulting object will have an attribute called
subsetgiving the indices of the kept points.- coeff
Relative size of text. Default is
1.
Value
A ggplot2 object. You can plot it using the print method.
You can modify it as you wish by adding layers. You might want to read
this chapter
to get more familiar with the package ggplot2.
Details
If you don't have information of chromosome and position, you should simply
use plot instead.
Examples
set.seed(9)
test <- snp_attachExtdata()
G <- test$genotypes
y <- rnorm(nrow(G))
gwas <- big_univLinReg(G, y)
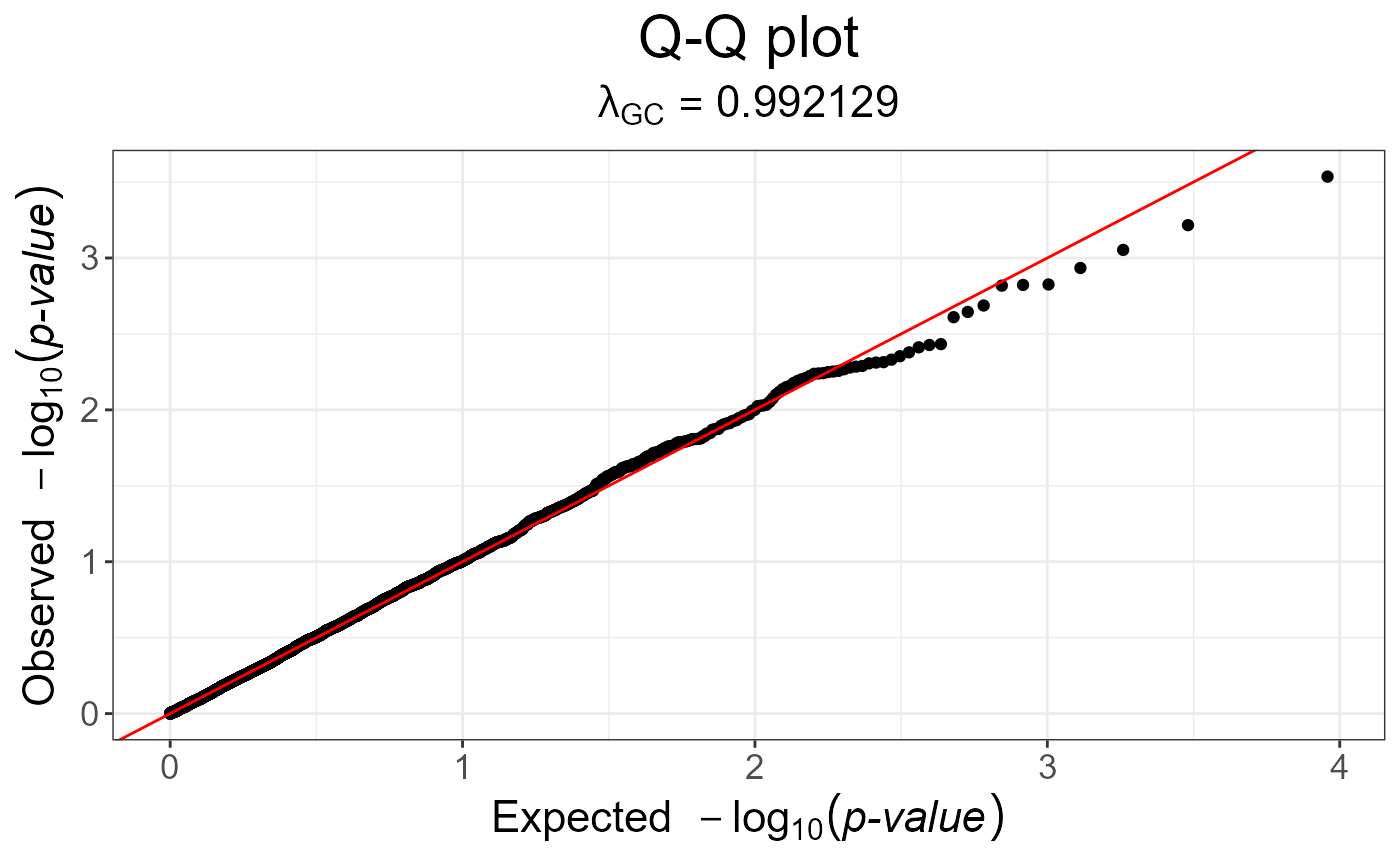
snp_qq(gwas)
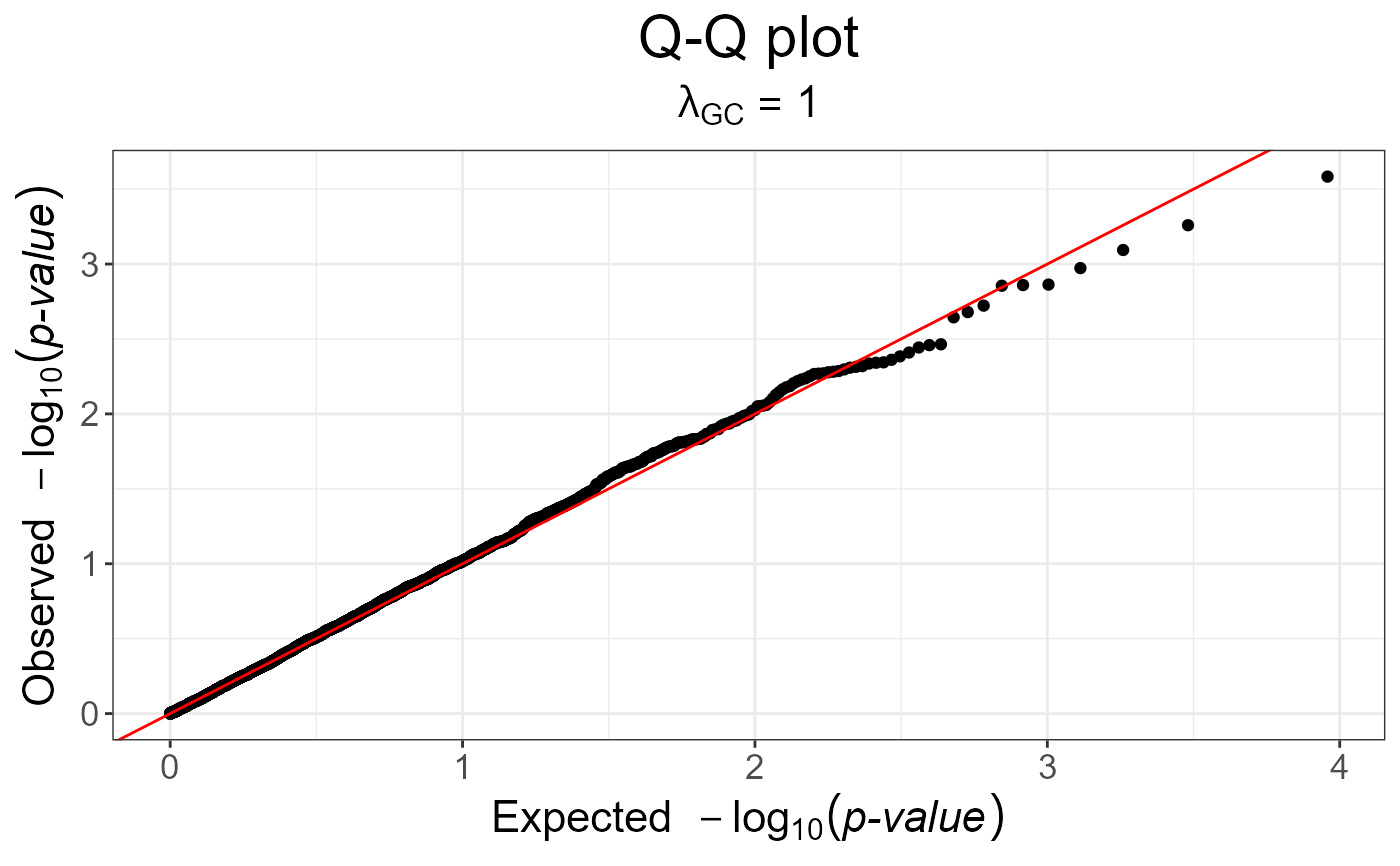
 gwas_gc <- snp_gc(gwas) # this modifies `attr(gwas_gc, "transfo")`
snp_qq(gwas_gc)
gwas_gc <- snp_gc(gwas) # this modifies `attr(gwas_gc, "transfo")`
snp_qq(gwas_gc)
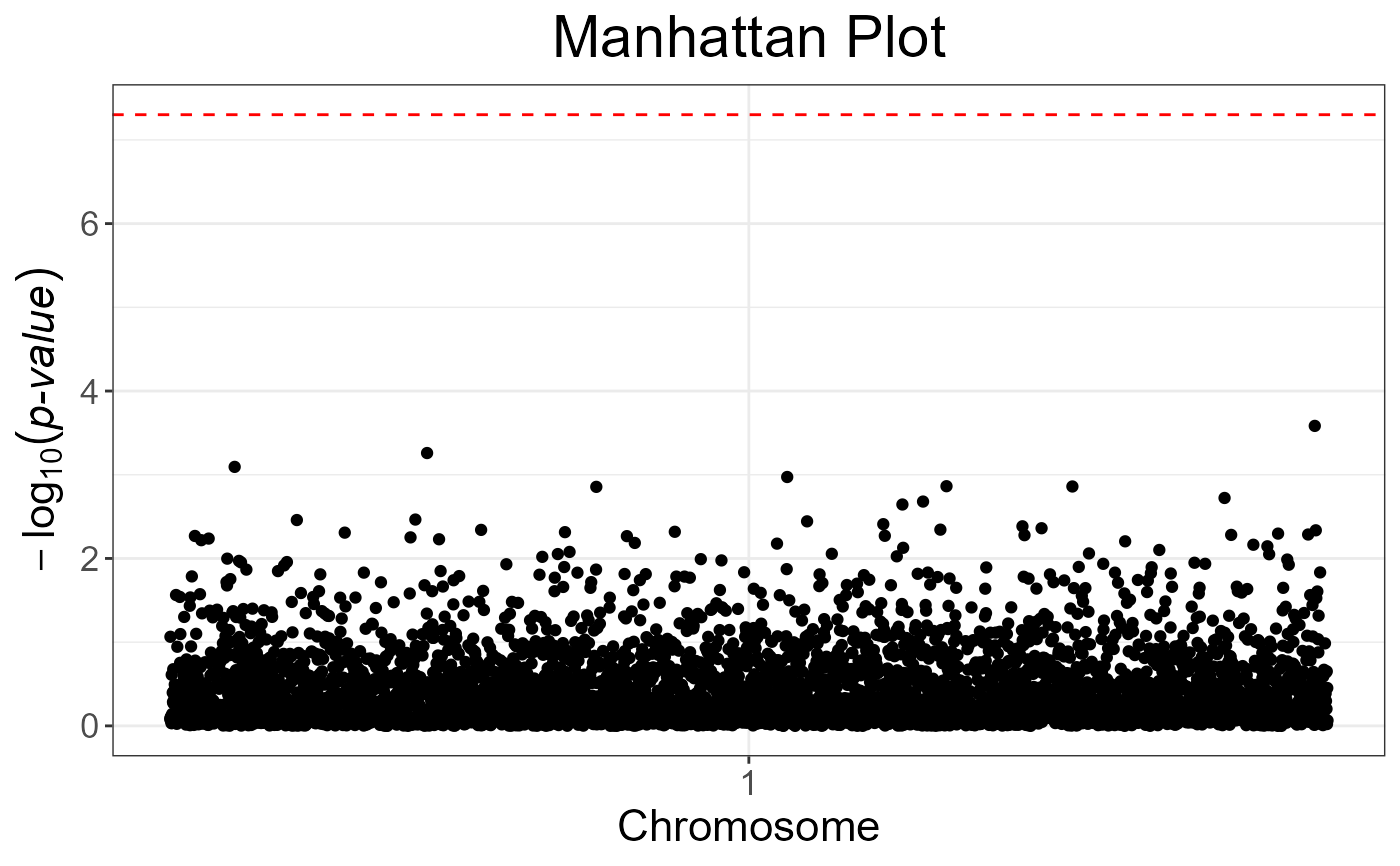
 # The next plot should be prettier with a real dataset
snp_manhattan(gwas_gc,
infos.chr = test$map$chromosome,
infos.pos = test$map$physical.pos) +
ggplot2::geom_hline(yintercept = -log10(5e-8), linetype = 2, color = "red")
# The next plot should be prettier with a real dataset
snp_manhattan(gwas_gc,
infos.chr = test$map$chromosome,
infos.pos = test$map$physical.pos) +
ggplot2::geom_hline(yintercept = -log10(5e-8), linetype = 2, color = "red")
 p <- snp_qq(gwas_gc) +
ggplot2::aes(text = asPlotlyText(test$map)) +
ggplot2::labs(subtitle = NULL, x = "Expected -log10(p)", y = "Observed -log10(p)")
if (FALSE) plotly::ggplotly(p, tooltip = "text")
p <- snp_qq(gwas_gc) +
ggplot2::aes(text = asPlotlyText(test$map)) +
ggplot2::labs(subtitle = NULL, x = "Expected -log10(p)", y = "Observed -log10(p)")
if (FALSE) plotly::ggplotly(p, tooltip = "text")